Transforming Employee Experience at KUKA Robotics
100% employee-driven design achieving 84% satisfaction and 27% collaboration boost
Project Overview
Role
Lead UX/Workplace Designer at Lech Büroplanung GmbH
Impact
  • 84% employee satisfaction,
  • 27% increase in cross-team collaboration
  • 41% growth in spontaneous interactions

Methods
Survey research, Leadership interviews, Co-creation workshops, Journey mapping, Low-fi prototyping
Tools
Miro, Microsoft Forms, Figma (spatial wireframes), AutoCAD
Duration
12 months
Team
Workplace consultant, Change Managers, Facility Manager, HR Head
Understanding the Landscape

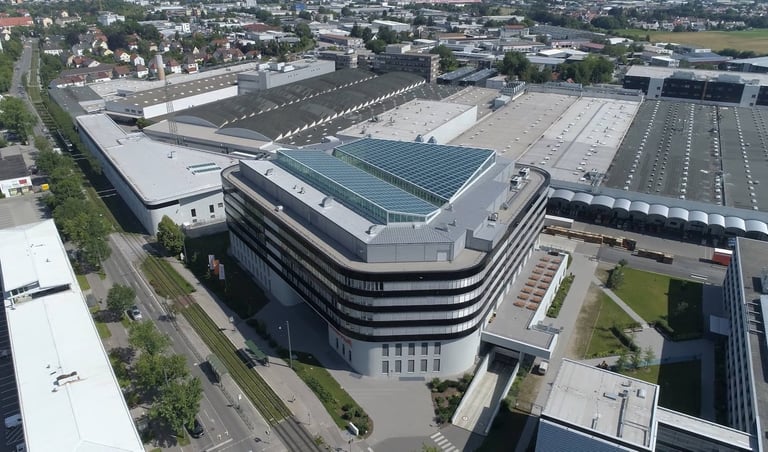
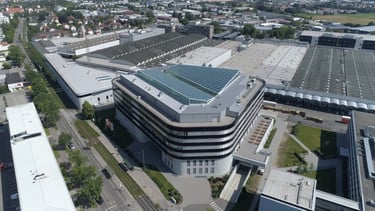
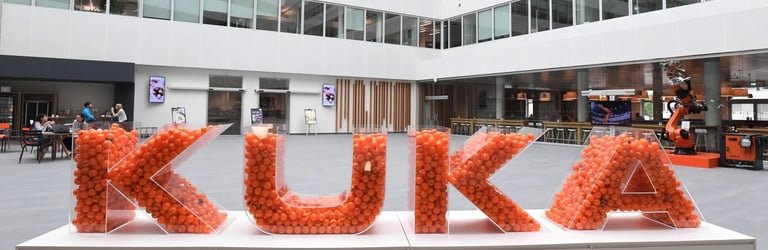
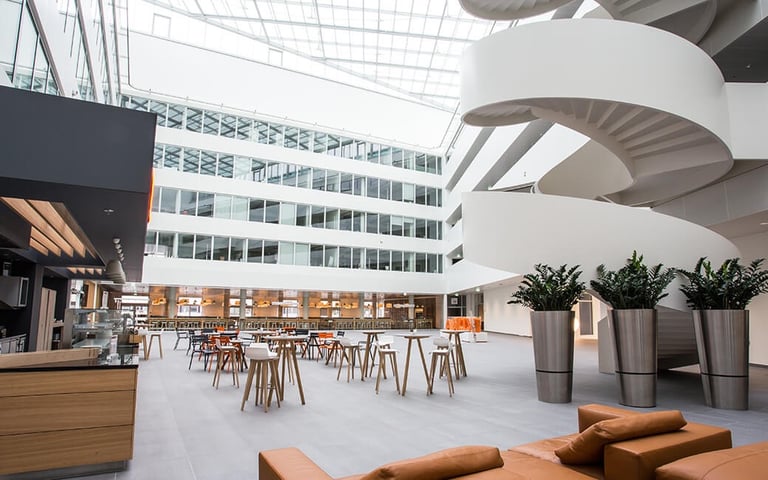
KUKA Robotics in Augsburg faced a critical issue post-pandemic: their 35 departments were scattered across multiple buildings with inconsistent workspace standards. Only 42% of employees regularly worked from the office, and internal surveys showed declining collaboration scores.

The Challenge

The Problem

Before jumping to solutions, we needed to understand why employees avoided the office. Through stakeholder kick-off workshop three pain points emerged:

  • Fragmented workflows – Daily workflow was split across floors and buildings.

  • Inefficient in-person meeting – Employees at times walked 08+ minutes between meetings

  • One-size-fits-all spaces – Organically growing departments left collaborations for hallways and digital means.

Leadership asked: How might we redesign our workspace to make coming to the office irresistible?

The real question wasn’t about aesthetics. It was about understanding how 35 different departments actually worked.

1

2

To capture a holistic view of employee experiences, we initiated a two-layered research process combining quantitative and qualitative methods.

Phase 1: Anonymous Department Survey (94% participation) focusing on:

We designed a 22-question survey focusing on:

  • Work style preferences (individual vs. collaborative time split)

  • Current pain points and frustrations

  • Technology and equipment needs

  • Commute willingness factors

Research That Revealed Hidden Patterns
Phase 2: Department Head Interviews (35 sessions)

Key Insight: 68% of employees valued “spontaneous collaboration opportunities” over dedicated desks, but current layouts made chance encounters nearly impossible.

One-on-one conversations revealed operational realities surveys couldn’t capture:

Strategic Decision: To test our approach, we began with a pilot project—the Facility Management Department of 88 employees at the core of operational logistics, this group became the perfect testbed to explore how spatial design could elevate organizational performance.

The R&D team needed at least 3+ hour focus block.

Customer service required 24/7 shift coverage with minimal handoff friction.

Sales teams traveled 70% of the time and needed hotel-style desking

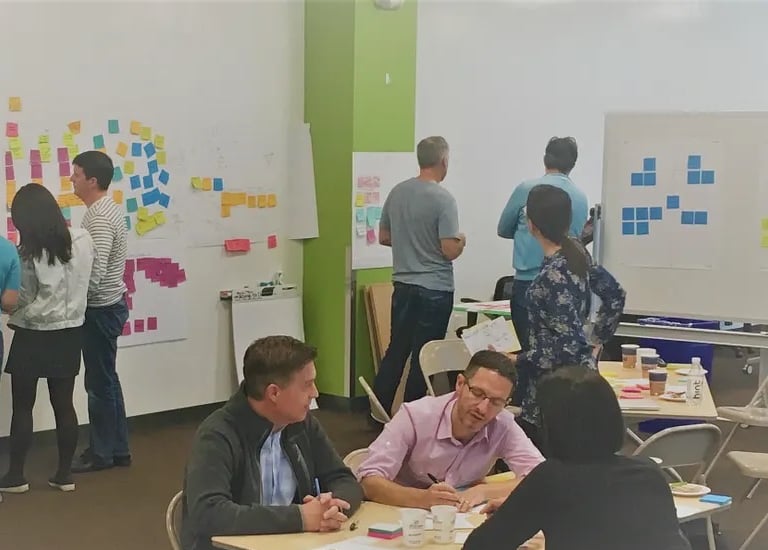
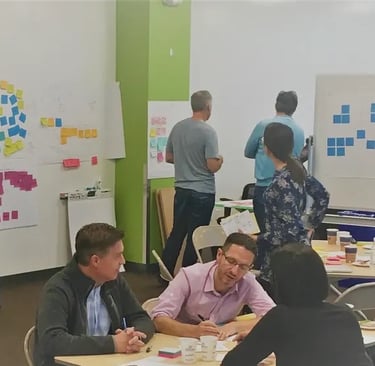
Co-Creation: Making Employees Co-Designers

Rather than redesigning in isolation, our team initiated a two-step co-creation workshop series with selected pilot departments—about 8–10 representatives per group.

Activity 1: A Day in Your Life

Workshop 1: Uncovering Microteam Dynamics
(10 employee representatives)

top three 3 activities from the workshop that gave insights into work patterns, disconnections, spatial journey

Activity 2: Keep, Change, Add

Activity 3: Space Journey Mapping

  1. Keep: Height-adjustable desks (mentioned by 9/10 participants)

  2. Change: “War room” that sat empty 80% of time while teams scrambled for ad-hoc space

  3. Add: “Concentration pods” for focused work between meetings

We created a physical map showing how teams moved through their day.

1. Microteam neighborhoods (4-8 people) clustered by collaboration frequency

2. Flexible “team spaces” replacing assigned conference rooms

3. Concentration zones between 09:00-15:00 (peak focus hours)

Participants mapped their typical Tuesday with sticky notes – meetings, focus work, collaboration moments. Pattern emerged: 40% of their day involved waiting for others or searching for available meeting spaces.

Workshop 2: Refining Reality (2 weeks later)

I presented lo-fi floor plan prototypes based on Workshop 1 insights. Using 1:50 scale furniture cutouts, participants physically rearranged spaces.

Critical moment: The department head wanted private offices restored. But when I showed data – 73% preferred open neighborhoods with optional quiet rooms – he saw employees prioritize team connection over status symbols.

Final prototype included:
  • 6 microteam neighborhoods (12-15 people each)

  • 3 concentration pods (bookable 2-hour slots)

  • 1 “project garage” – reconfigurable space for sprint work

  • Shared collaboration zones every 15 meters

Acceptance vote: 93% approval from department representatives

The pilot space once launched was tracked for success metrics for 3 months:

Prototype to Performance: The Pilot Results
  • Office attendance: 42% → 76% (+34 percentage points)

  • Employee satisfaction: 58/100 → 84/100 (NPS increased by 26 points)

  • Collaboration frequency: 2.3 → 4.1 interactions per day (78% increase)

  • Meeting room utilization: 65% → 89% efficiency

  • “I have space when I need it”: 41% → 88% agreement

Quantitative Impact
Qualitative Feedback

I was skeptical about losing my assigned desk, but now I see why it works. When I’m traveling Monday-Wednesday, someone else uses that spot. When I’m back Thursday-Friday, I sit with my team. No wasted space, and I actually feel more connected than when I had a desk collecting dust.”

I actually look forward to Mondays now. My team sits together, and I can grab someone for a 5-minute question instead of scheduling a video call.”

Design Decisions That Mattered
Why pilot ??

Testing with one department validated hypotheses before committing millions. It also cultivated internal champions who promoted the initiative across other departments.

Why two phased workshop ??

Workshop 1 captured the team’s raw needs. The two-week gap that followed allowed me to translate ideas into tangible prototypes, while participants gathered feedback from rest of the employees of the departments on the key takeaways.

Workshop 2 then grounded the discussions in reality, ultimately reducing post-launch complaints by an estimated 60%.

Why employee representatives vs. all-hands ??

8-10 diverse voices (mix of seniority, roles, work styles) provided richer insights than 80+ person town halls. Representatives became change ambassadors to their peers.

Why journey mapping over standard surveys ??

Surveys tell you what people say they do. Journey mapping reveals what they actually do. The disconnections amongst microteams did not clearly reflect in the survey but emerged in the spatial mapping activities.

What I Learned
  1. In workplace design, participation equals adoption — true transformation happens when employees co-create the change.

  2. UX research methods such as journey mapping, low-fidelity spatial prototyping, and affinity clustering can effectively translate into physical spatial experiences.

  3. Piloting before scaling allows data-backed learning loops, ensuring long-term organizational trust in transformation initiatives.